Personal Quant Research & Trading Engine
A systematic equity research and execution platform built from scratch in Python, designed to take trading strategies from hypothesis through backtesting to paper (and eventually live) execution on US equities via Alpaca.
Repository: GitHub | Notebooks: Data Exploration
Portfolio Dashboard
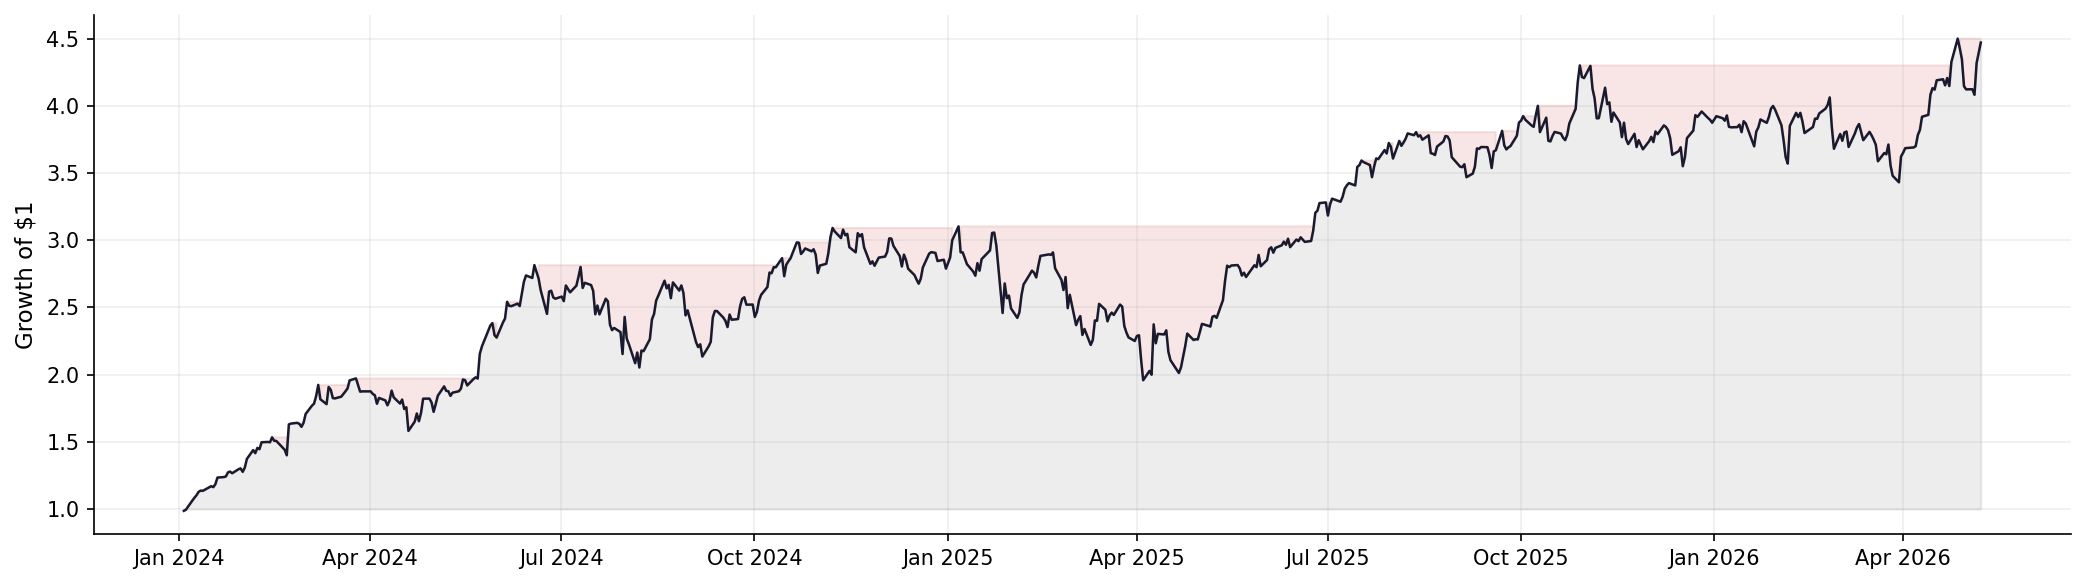
How these metrics are computed
All metrics are computed on simple (not log) returns, indexed by trading day. Risk-free rates are compounded per-period rather than linearly approximated. Default annualization assumes 252 trading days per year.
Pipeline
Solid border indicates implemented modules. Dashed border indicates modules under development.
Progress
Benchmark-relative & distribution metrics
Added beta, alpha (Jensen's), tracking error, information ratio, up/down capture, VaR, CVaR, skewness, kurtosis, tail ratio, and expected tail ratio. Full tearsheet redesign with 22-metric dashboard. 119 unit tests.
Alpha framework & vectorized backtester
Built abstract alpha base class with four factors (momentum, cross-sectional momentum, RSI, Bollinger z-score). Implemented vectorized backtester with dollar-neutral positioning, transaction cost modeling, and IC analysis module.
Performance analytics suite & data exploration
Implemented Sharpe, Sortino, Calmar, max drawdown, win rate, profit factor with full edge-case handling. Published data exploration notebook covering return distributions, cross-sector correlations, and volatility dynamics.
Historical data pipeline
Built Alpaca market data client and Parquet-based storage with smart incremental fetching, deduplication, and multi-timeframe support (1min to daily).
Core domain model
Designed type-safe data structures (Bar, Signal, Order, Fill, Position) using frozen dataclasses and enums. Established project scaffold with strict typing and linting.
Tooling & Quality
- Language
- Python 3.13
- Type checking
- mypy (strict mode)
- Linting
- ruff
- Testing
- pytest
- Packaging
- pyproject.toml + hatchling
- Data format
- Apache Parquet (columnar, compressed)
- Libraries
- Pandas, NumPy, Pydantic, Alpaca SDK, PyArrow
Attributes
- Status
- Active development (paper trading)
- Period
- 2026 – present
- Affiliation
- Independent research
- Market
- US Equities
- Broker
- Alpaca (paper + live)
- Repository
- GitHub